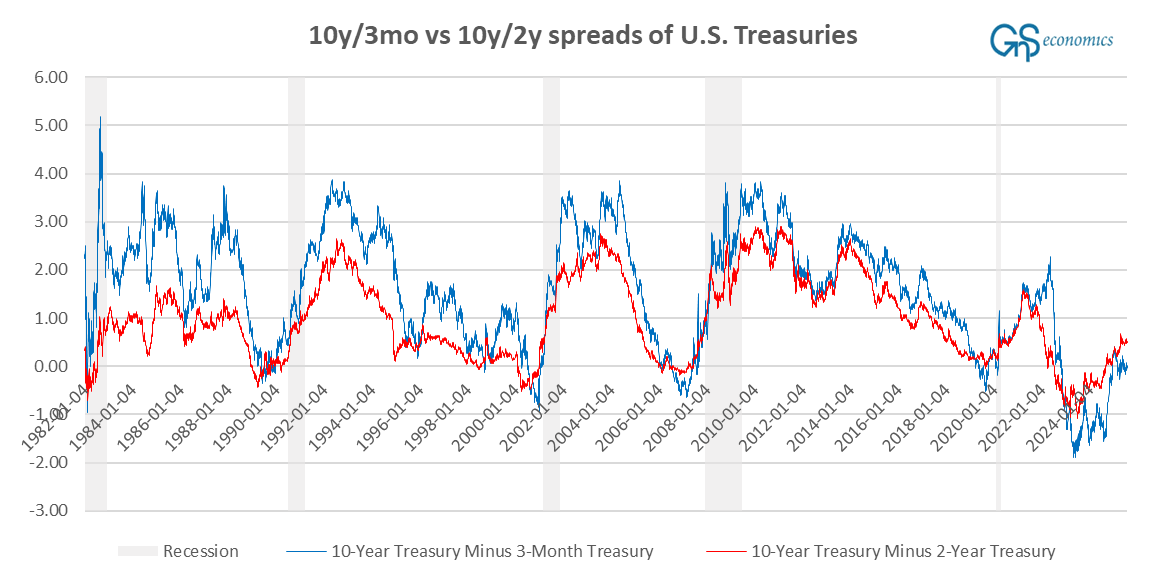
Let’s update the situation with U.S. yield curves. As you know, I and we at GnS Economics have concentrated on the 10-year/3-month and 10-year/2-year spreads of Treasury bonds because they have been found to have the most predictive power concerning the onset of recessions. This is where they left off on Friday.

Like I noted before, there are two peculiarities. First, the reinversion of the 10y/3mo spread has effectively stopped, with the values of the spread fluctuating around zero. Secondly, the reinversion of the 10y/2y spread is exceptionally sluggish. The only time we have seen such a sluggish reinversion (since 1982) was after the first Corona lockdowns (in the spring of 2020). It’s likely that the reinversion is so sluggish for the same reason. That is, because there has been such a massive stimulus, which in some form continues still in the wake of the ‘Big Beautiful Bill.’
The same strange behavior continues with the private sector yield curve (it’s not going anywhere). However, our forecasts on OECD’s leading indicators, published on Friday, may provide a clue as to why this is.
Keep reading with a 7-day free trial
Subscribe to Tuomas Malinen on Geopolitics and the Economy to keep reading this post and get 7 days of free access to the full post archives.


