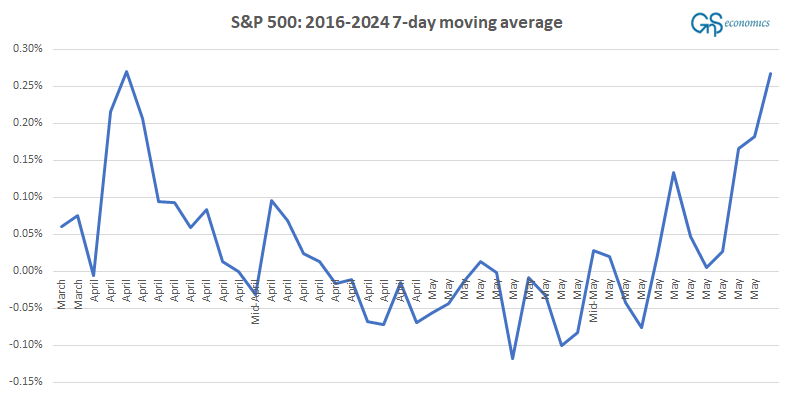
On Wednesday I published this figure depicting the moving average of S&P 500 in April and May between 2016 and 2024 (with 2020 excluded). Where are we now?
Keep reading with a 7-day free trial
Subscribe to Tuomas Malinen on Geopolitics and the Economy to keep reading this post and get 7 days of free access to the full post archives.


