Issues contributed:
The signal value of the yield curve has been hampered by the ‘bond rout’.
The Federal Reserve has lost control of the yield curve.
Repercussions of a continued bond market rout could be chaotic.
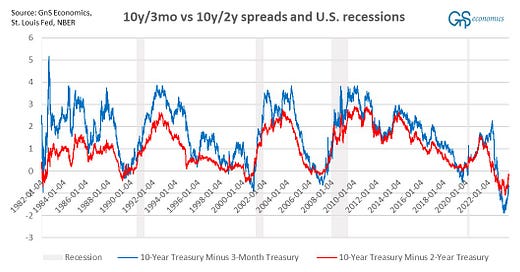
This is a figure many economists have been staring, and commenting, lately.
This naturally includes us at GnS Economics, as the U.S. yield curve is the ‘bread and butter’ in recession forecasting. What the figure presents are spreads, i.e., differences between the yield of the U.S. Treasury Note with 10-year maturity and yields of U.S. Treasury Bill with 3-month maturity and U.S. Treasury Note with 2-year maturity, respectfully. These will be called 10y/3mo and 10y/2y spreads from here on. It’s said that the yield curve is “inverted”, when the yield of 3mo and/or 2y is higher than that of 10y resulting to a negative difference.
Yield curves are used in recession forecasting, because of their keen (historical) ability to anticipate the arrival of recessions. According to the academic literature, the 10y/3mo spread is a very reliable recession predictor. Recession has followed 9-17 months after the inversion, at least since 1968.
The funny thing is that no one actually knows why inversions of the yield curve have been so good in anticipating recessions. One explanation is that because yield-curve inversion also affects the profitability of banks, as they “borrow” (give out deposits) in short maturities and lend in long maturities. Yield-curve inversion can thus become a ‘self-fulfilling prophecy’, because it diminishes the profitability of banks and forces them to tighten their lending standards causing a recession.
Another explanation is that the yield curve presents the differing views of the Federal Reserve and bond investors. This implies that, when the curve inverts, bond investors view the long-run prospects of the economy to be better than the short-run prospects preferring a bond with a long maturity. This rises the prices of bonds with long maturities pushing their yields down. The opposite happens with the short-maturity bonds (like the 3mo and 2y), and the yield curve inverts.
A reversal, or an ‘un-inversion’, occurs when the Fed starts to lower interest rates in an expectation of slowing inflation, which tend to affect short term rates in the markets. Investors seek short-term shelter from the money markets resulting to a increased demand for short-dated bonds, resulting to a rise in their price and subsequent fall in their yields.1
This un-inversion has usually been a sign of an imminent onset of a recession. As shown in the figure above, such a shift has is occurring currently, but something is different this time around distorting the signal of the yield curve.
The yield conundrum
This figure shows the current anomaly at the level of yields.
Keep reading with a 7-day free trial
Subscribe to Tuomas Malinen on Geopolitics and the Economy to keep reading this post and get 7 days of free access to the full post archives.


