What about dat recession?
Historical evidence suggest that the onset of U.S. recession is very close. (Free)
I and we at GnS Economics have been tracking the onset of U.S. recession for a year. In April 2024, I noted that
When we observe the (Y-o-Y) growth of loans and leases of U.S. banks, we notice that they continue to hover at recession levels. I expected to see an improvement during February and March, due to improved mood among consumers and expectations of rate cuts, but this failed to materialize almost totally as shown by the figure below. This enforces the message of loan demand, i.e., that the U.S. economy is nearing a credit recession.
Our current forecast is that the U.S. recession will commence between Q3 and Q4. This has been drawn mostly on simple deduction of the underlying undercurrents in the U.S. economy and on yield curves.

Next, I provide more evidence indicating that the onset of (actual) U.S. recession is very close.
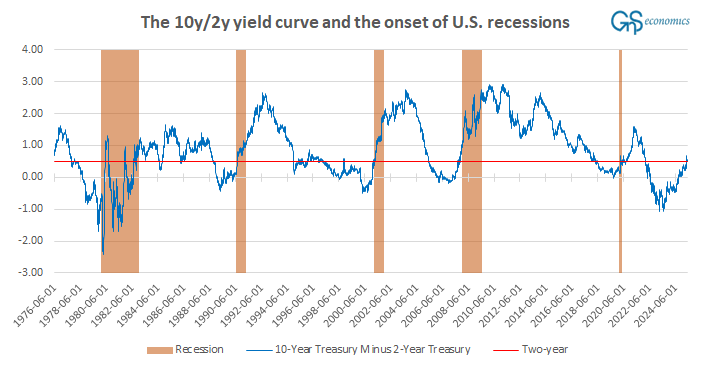
While the 10-year/3-month yield curve is still ‘zig-zagging’, the 10-year/2-year yield curve is acting more consistently. It also provides a definite historical result, according to which the onset of U.S. recession should be just around the corner. In the figure below, I have drawn a line (in red) depicting where the 10y/2y yield curve is now compared to its historical record.

The spread of U.S. Treasury Notes with 10-year and 2-year maturities currently stands at around 0.5. It reached 0.68 in late April, so we could also draw the line higher. This, however, would change the conclusion only marginally. The (historical) fact is that every time the 10y/2y yield curve has reached this level, recovering from an inversion, the U.S. economy has either been in a recession already or then its onset has been just three months away.1
Sure, uncertainties abound, but the writing is on the wall.
Tuomas
Disclaimer:
The information contained herein is current as of the date of this entry. The information presented here is considered reliable, but its accuracy is not guaranteed. Changes may occur in the circumstances after the date of this entry, and the information contained in this post may not hold true in the future.
No information contained in this entry should be construed as investment advice nor advice on the safety of banks. Readers should always consult their own personal financial or investment advisor before making any investment decision or decision on banks they hold their money in. Readers using this post do so solely at their own risk. GnS Economics, any of its partners and employees, nor Tuomas Malinen cannot be held responsible for errors or omissions in the data presented.
Readers must make an independent assessment of the risks involved and of the legal, tax, business, financial, or other consequences of their actions. GnS Economics nor Tuomas Malinen or any other authors cannot be held i) responsible for any decision taken, act or omission; or ii) liable for damages caused by such measures.
In September 2007, the 10y/2y yield curve broke the 0.5 mark on the 18th and rose close to 0.7 (0.66) on the 26th, after declining for a while. The U.S. recession started in December 2007.


